Translate this page into:
A cross-sectional study using patch testing with Indian standard series to find the prevalence of sensitization in patients of atopic dermatitis
*Corresponding author: Disha Chakraborty, Department of Dermatology and Clinical Immunology, UC Davis and VA Medical Center, Sacramento, United States. docdishachaks@gmail.com
-
Received: ,
Accepted: ,
How to cite this article: Srivastava PK, Chakraborty D, De A. A cross-sectional study using patch testing with Indian standard series to find the prevalence of sensitization in patients of atopic dermatitis. Indian J Skin Allergy. 2025;4:52-6. doi: 10.25259/IJSA_17_2024
Abstract
Objectives
Atopic dermatitis (AD) and contact dermatitis (CD) have a complicated and debatable correlation. A large number of studies have suggested that AD patients have a higher prevalence of contact allergy than non-AD patients. In this study, we aimed to compare the prevalence and patterns of CD in AD and non-AD patients using patch testing. We also investigated the gender distribution and the sources of contact allergens in both groups. This study aimed to examine the frequency and characteristics of contact allergy in individuals with AD and those without atopic conditions by the utilization of patch testing. In a co-primary objective, we hypothesized that individuals with AD would exhibit a higher prevalence of contact allergy compared to those without AD, aiming to validate or refute this null hypothesis.
Material and Methods
We included all adult patients (age >18 years) who had undergone patch testing with a suspected diagnosis of CD. In this group, we further divided the cases into two subgroups, patients with AD and non-AD patients. Exclusion criteria included pregnancy, lactation, use of systemic corticosteroids within the past 10 days, and use of immunosuppressive agents within the past 8 weeks. The haptens were pasted on the back of the skin for 48 hours. Assessments were conducted on day 2 (D2) and day 4 (D4), and in certain cases, day 7 (D7) was performed as per the recommendations of the International CD Research Group standards.
Results
We recruited 64 patients who underwent patch testing for contact allergies. Of these, 29 had AD and 35 did not have AD. In our cohort, 36 patients (56%) were positive for contact allergies and 28 were negative. Of these, 18 out of 29 AD patients (62%) and 18 out of 35 non-AD patients (51%) were positive for contact allergies. The most common contact allergens in both groups were nickel, cobalt, and potassium dichromate. Other allergens included fragrance mix I, benzocaine, wool alcohol, colophony, and neomycin. There was no significant difference in the frequency of contact allergy between AD and non-AD patients (P = 0.41). The majority of the positive patch test reactions were relevant in both groups.
Conclusion
Both patients with AD and those without AD may have sensitization to different occupational or non-occupational antigens. In addition, individuals with AD are more prone to contact allergies compared to those without AD.
Keywords
Atopic dermatitis
Contact dermatitis
Patch testing

INTRODUCTION
Atopic dermatitis (AD) is a persistent inflammatory dermatological condition that impacts around 20% of the pediatric population and 2–3% of the adult population globally.[1,2] AD is characterized by compromised integrity of the skin barrier, resulting in vulnerability to infections and an augmented immunological reaction.[3] Contact dermatitis (CD) is an inflammatory skin condition that results from exposure to external substances that trigger allergic or irritant reactions. CD can be categorized into various types based on the characteristics and mechanism of the eliciting agent. These classifications include allergic CD (ACD), irritant CD (ICD), photo contact, and contact urticaria. Patch testing is the gold standard for diagnosing ACD and identifying the responsible allergens. Patch testing involves applying standardized allergen preparations to the skin under occlusive patches and observing the reactions after 48 hours (D2) and 96 hours (D4). Delayed Patch test reading, that is D7 reading, also helps differentiate ACD from ICD and other dermatoses that may mimic CD.[4]
The association between AD and CD is intricate and subject to debate. Several studies have indicated that individuals with AD exhibit a greater incidence of contact allergies compared to those without AD, particularly with metals such as nickel, cobalt, and chromium. Additional research has indicated a reduced or comparable occurrence of contact allergy in individuals with AD in comparison to those without AD. The variations in the outcomes could be attributed to other factors, including patient selection, diagnostic criteria for AD and CD, patch test methodology, and regional disparities in allergen exposure.[5]
In this study, we aimed to compare the prevalence and patterns of contact allergy in AD and non-AD patients using patch testing. We also investigated the gender distribution and the sources of contact allergens in both groups.
MATERIAL AND METHODS
This study aimed to examine the frequency and characteristics of contact allergy in individuals with AD and those without AD through the utilization of patch testing. In an additional co-primary goal, it was postulated that individuals diagnosed with AD would have a greater prevalence of contact allergy compared to those without AD. Our hypothesis proposed that individuals with AD would exhibit a greater prevalence of contact allergy compared to those without AD. We attempted to establish or disprove the null hypothesis.
We performed patch testing on all patients using the Indian Standard Series procured from Chemotechnique Diagnostics, Vellinge, Sweden®, which contains standardized haptens for diagnosing contact allergy. According to the UK Working Party’s diagnostic criteria, a diagnosis of AD requires an itchy skin condition and at least three of the following: A history of flexural involvement, asthma or hay fever, generalized dry skin in the past year, visible flexural eczema, or onset of rash before the age of 2 years.[1,3]
The patch test procedure involves applying standardized haptens into small chambers (Finn Chambers) mounted on tape (Patch Test Units) and placing them onto the patient’s skin. The haptens remained in direct contact with the skin for 48 hours and after that, patches were removed, and the reactions were read half an hour after removing the patches (day 2; D2). We re-examined the patch test site again after 96 hours (day 4; D4) and where indicated, a reading on day 7 (D7) was taken. The reactions were graded according to the International CD Research Group (ICDRG) guidelines.[6] The reactions were graded according to their intensity, morphology, and distribution. The grading system exhibits variability between various patch test systems and research groups, typically encompassing a spectrum from negative (0) to weakly positive (+), moderately positive (++), and very positive (+++). Reactions with a score of 1+, 2+, or 3+ were regarded as positive allergic responses according to the ICDRG scoring system.
The data were analyzed using descriptive statistics, and a comparison was made between patients with AD and those without AD using Chi-square tests and Fisher’s exact tests. The qualitative variables were expressed as frequencies and percentages and the quantitative variables were described using means (± standard deviation) or medians (interquartile range) as appropriate. The odds ratios and 95% confidence intervals were computed to assess the magnitude of the relationship between AD and contact allergy.
RESULTS
We recruited a total of 64 patients to undergo patch testing for contact allergies, of whom 29 were diagnosed with AD and 35 did not have AD [Figure 1]. The mean age of the participants across both groups was 36.4 ± 15.3 years. When analyzed separately, the AD group had an older average age of 39.4 ± 21.3 years compared to 32.6 ± 14.2 years in the non-AD group (P = 0.148). This indicates that the AD group included a relatively older subset of participants compared to the non-AD group. The majority of participants were female, with 51 out of 64 (79.7%) being women and only 13 (20.1%) being men. Female predominance was observed in both groups, with 72.4% (21 of 29) in the AD group and 85.7% (30 of 35) in the non-AD group (P = 0.224). This suggests a higher female representation in the study, especially in the non-AD group.
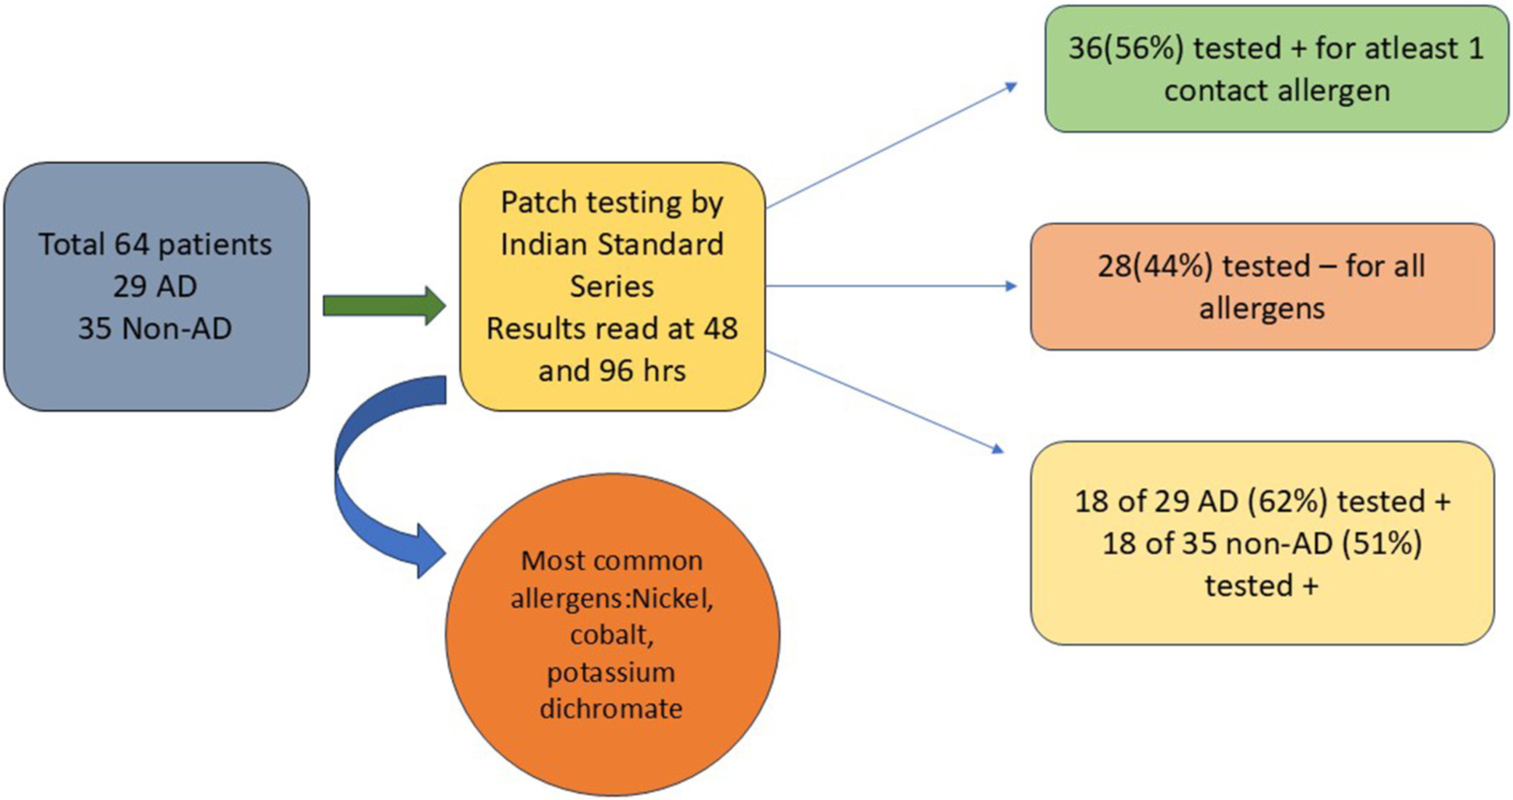
- Image representing the study methodology. AD: Atopic dermatitis.
Among the 64 participants, 36 individuals (56%) tested positive for at least one contact allergen, while 28 (44%) tested negative for all allergens. Breaking this down further, 18 out of the 29 AD patients (62%) showed positive reactions, compared to 18 out of the 35 non-AD patients (51%). The total number of positive reactions observed was 44, distributed among the 36 patients who exhibited at least one positive result. In contrast, 28 participants – comprising individuals from both the AD and non-AD groups – showed no positive reactions to any of the allergens tested [Figures 2 and 3].
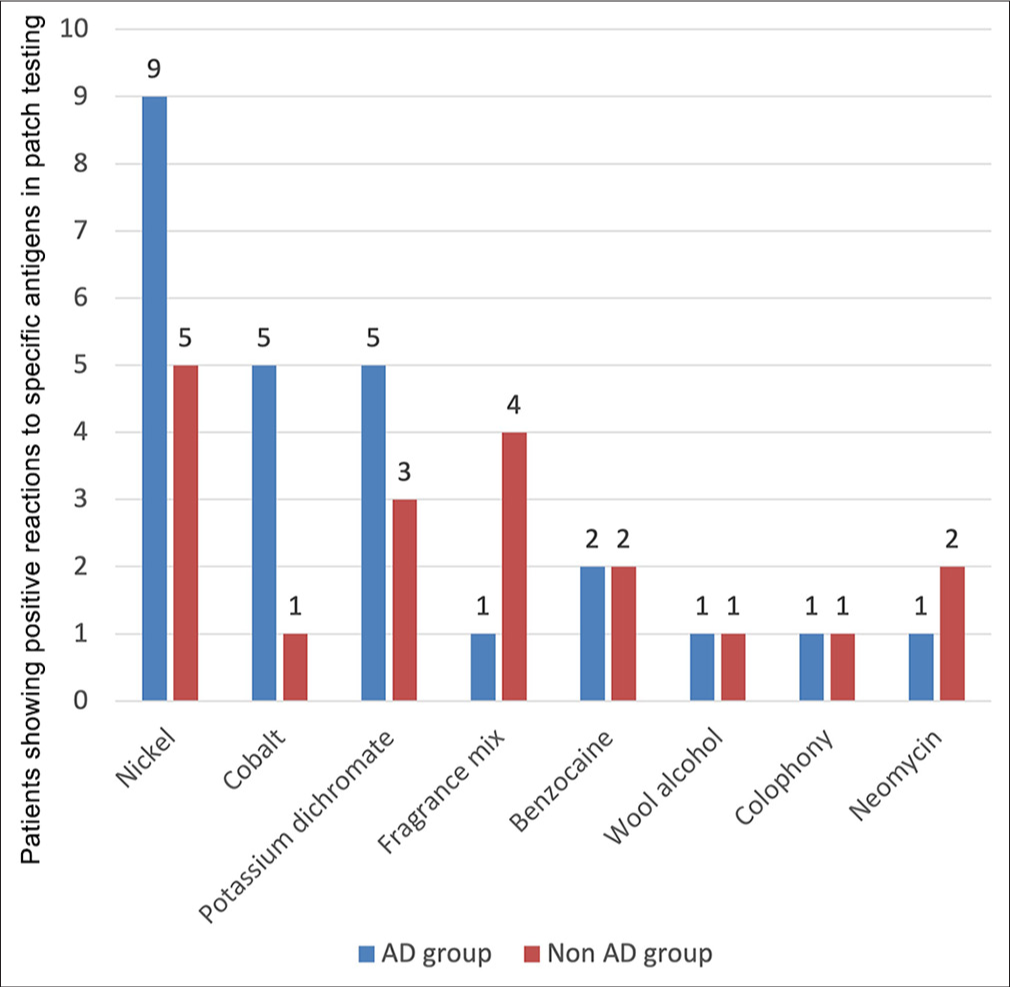
- Frequency and distribution of contact allergens in atopic dermatitis (AD) and non-AD patients. The AD group is presented in blue and non AD in red. Nickel:9 in AD, 5 in non AD, Cobalt:5 in AD, 1 in non AD, dichromate:5 in AD, 3 in non AD, fragrance mix: 1 in AD, 4 in non AD, benzocaine: 2 in AD, 2 in non AD, wool alcohol: 1 in AD, 1 in non AD, colophony: 1 in AD, 1 in non AD, neomycin : 1 in AD, 2 in non AD.
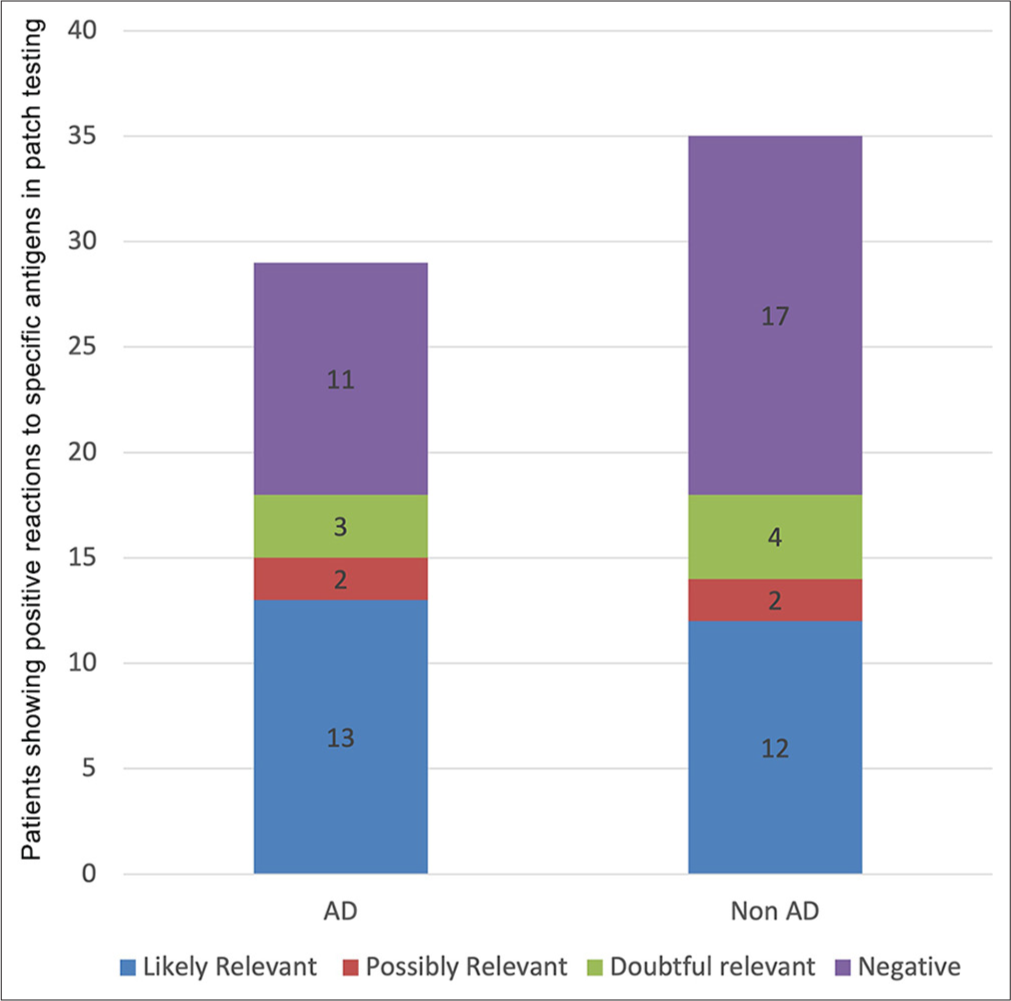
- Percentage of relevant and non-relevant reactions in atopic dermatitis (AD) and non-AD patients. The AD group is presented in blue and non AD in red. Nickel:9 in AD, 5 in non AD, Cobalt:5 in AD, 1 in non AD, dichromate:5 in AD, 3 in non AD, fragrance mix: 1 in AD, 4 in non AD, benzocaine: 2 in AD, 2 in non AD, wool alcohol: 1 in AD, 1 in non AD, colophony: 1 in AD, 1 in non AD, neomycin : 1 in AD, 2 in non AD.
The results of the patch test study are summarized in Table 1 and Figure 1. Table 1 presents the demographic characteristics, diagnoses, and overall patch test outcomes for the 64 participants, while Figure 1 illustrates the frequency and distribution of contact allergens identified through patch testing with the Indian standard series among AD and nonAD groups. Nickel emerged as the most common allergen, with 14 positive reactions (31.8%) overall – 9 in the AD group and 5 in the non-AD group (P = 0.0734). Cobalt (6, 13.6%), potassium dichromate (8, 18.1%), and benzocaine (4, 9.1%) were also frequently identified, with similar distributions between the two groups. Less frequent allergens included fragrance mix I (5, 11.3%), wool alcohol (2, 4.5%), colophony (2, 4.5%), and neomycin (3, 6.8%), showing minor variations in occurrence between AD and non-AD patients. These findings, as depicted in Figure 1, highlight the overall prevalence of specific contact allergens, emphasizing nickel, cobalt, and potassium dichromate as the most commonly encountered across both groups.
There was no significant difference in the frequency of contact allergy between AD and non-AD patients (P = 0.41). After using the Chi-square test with a degree of freedom of 1 (the critical value for a = 0.05 is approximately χ2 = 3.84), we found from our data, that χ2 = 0.68 is <χ2 = 3.84, so we failed to reject the null hypothesis at a = 0.05 level of significance. Therefore, we can conclude that there is no significant difference between AD and non-AD patients in terms of patch test positivity.
| Variable | Atopic dermatitis group (n=29) | Non-atopic dermatitis group (n=35) | Total (n=64) | P-value |
|---|---|---|---|---|
| Age (years) | 39.4±21.3 | 32.6±14.2 | 36.4±15.3 | P=0.148 |
| Male (%) | 8 (27.6) | 5 (14.3) | 13 (20.1) | P=0.224 |
| Female (%) | 21 (72.4) | 30 (85.7) | 51 (79.7) | P=0.224 |
| Positive (Patch test) (%) | 18 (62.1) | 18 (51.4) | 36 (56.2) | P=0.454 |
| Negative (%) | 11 (37.9) | 17 (48.6) | 28 (43.8) | P=0.454 |
The relevance of the positive patch test reactions was assessed using the modified scoring system proposed by Lachapelle et al.[6] Figure 3 shows the percentage of relevant and non-relevant reactions in both groups. Most of the positive patch test reactions were relevant in both groups. In the AD group, 13 out of 18 positive reactions (72.2%) were likely relevant, and 2 out of 18 positive reactions (11.1%) were possibly relevant. In the non-AD group, 12 out of 18 positive reactions (66.7%) were likely relevant, and 2 out of 18 positive reactions (11.1%) were possibly relevant. There was no significant difference in the relevance of the positive patch test reactions between AD and non-AD patients (P = 0.87; [Figure 3]). Figure 1 summarizes the entire methodology of this study. Overall, the data reveal that certain allergens, especially nickel, are more prevalent in AD patients, although the difference is not statistically significant. Other allergens exhibit a comparable distribution between the two groups. This highlights the importance of nickel as a significant sensitizer in AD patients and suggests the need for tailored allergen avoidance strategies in managing these patients.
DISCUSSION
The objective of this study was to assess and contrast the prevalence and trends of contact allergy in individuals with AD and those without AD using a patch test. The findings indicated that there was no statistically significant disparity in the occurrence of contact allergy between individuals with AD and those without AD (P = 0.41). Metals such as nickel, cobalt, and potassium dichromate were the most prevalent contact allergies in both groups.[7]
The level of positivity shown in patch tests is indicative of the extent of sensitivity to the allergen and the probability of clinical significance. A mildly positive response may suggest a mild sensitization or a cross-reactivity with an allergen that shares a similar structure. A strongly positive reaction may suggest the presence of a high-grade sensitivity or a primary sensitization to the allergen. Nevertheless, the clinical significance of the reaction cannot be only determined by the degree of patch test positive.[7] The clinical significance of patch test reactions is determined by various criteria, including the form, location, timing, and severity of the dermatitis, alongside the individual’s history of allergen exposure. The clinical relevance of a positive patch test reaction is determined by its correspondence to the patient’s previous exposure to the allergen and its ability to elucidate the clinical manifestations of the dermatitis. The absence of a positive patch test result does not necessarily rule out the potential presence of ACD, given that the patch test only encompassed a limited number of allergens.
Nevertheless, previous research has indicated that individuals with AD exhibit a greater incidence of contact allergy compared to those without AD, particularly in metals such as nickel, cobalt, and chromium. The elevated occurrence of CD in AD can be attributed to the shared immunologic pathways associated with the disease.[6] The variances in the outcomes could be attributed to other factors, including patient selection, diagnostic criteria for AD and CD, patch test methodology, and regional disparities in allergen exposure.[8] A significant proportion of the positive patch test reactions were observed in both groups, suggesting that contact allergy could potentially contribute to the development or worsening of dermatitis in both individuals with AD and those without AD. Contact allergy has the potential to exacerbate the integrity of the skin barrier and heighten vulnerability to infections and environmental allergens in individuals with AD.[6,8,9] Contact allergy has the potential to induce chronic or recurring dermatitis that exhibits similarities or overlaps with AD in individuals without AD.[9]
Nickel, cobalt, and potassium dichromate were identified as the prevailing contact allergens in both groups. These metals are widely used in various products, such as jewelry, coins, buttons, zippers, tools, crayons, dental materials, and leather products. Nickel is also present in some foods, such as chocolate, nuts, legumes, grains, and canned foods. The high frequency of metal allergy may reflect the high exposure to these metals in the general population and occupational groups. Further, our data reveal that nickel was more prevalent in AD patients. This highlights the importance of nickel as a significant sensitizer in AD patients and suggests the need for tailored allergen avoidance strategies in managing these patients. Other contact allergens that were detected in this study included fragrance mix I, wool alcohol, colophony, and neomycin. These substances are commonly found in cosmetics, personal care products, topical medications, and adhesive materials.[10] The frequency and distribution of these allergens may vary depending on the usage patterns and preferences of the patients. Our study revealed an interesting finding: a higher prevalence of patch test-positive reactions among females. This aligns with a recent study involving 150 patients with CD, where 56% were female and 44% were male. In addition, the study highlighted that nickel sensitivity was more common in females.[11] However, the underlying reasons for this female predominance remain unclear. The study is subject to certain limitations, namely the small sample size and the single-center design. To validate and extend the findings of our study, it is recommended that future research employs bigger sample sizes, multi-center recruitment, and matched controls.
CONCLUSION
Our study compared the prevalence and patterns of contact allergy in AD and non-AD patients using patch testing. The results showed that contact allergies in AD are more common than in the non-AD group. The most common contact allergens in both groups were metals such as nickel, cobalt, and potassium dichromate, followed by preservatives, fragrances, and medicaments. Most of the positive patch test reactions were relevant in both groups, indicating that contact allergy may play a role in recurrent or recalcitrant dermatitis in both AD and non-AD patients. We conclude that both AD and non-AD patients may be sensitized to various occupational and non-occupational exposures, and patch testing to identify the cause should be part of the routine diagnostics in both types of eczemas.
Ethical approval
Institutional Review Board approval is not required.
Declaration of patient consent
The authors certify that they have obtained all appropriate patient consent.
Conflicts of interest
There are no conflicts of interest
Use of artificial intelligence (AI)-assisted technology for manuscript preparation
The authors confirm that there was no use of artificial intelligence (AI)-assisted technology for assisting in the writing or editing of the manuscript and no images were manipulated using AI.
Financial support and sponsorship: Nil.
References
- Current burden of atopic dermatitis in India: A systematic literature review. Indian J Dermatol. 2023;68:487.
- [CrossRef] [PubMed] [Google Scholar]
- Burden of disease, unmet needs in the diagnosis and management of atopic dermatitis: An Indian expert consensus. Clin Cosmet Investig Dermatol. 2021;14:1755-65.
- [CrossRef] [PubMed] [Google Scholar]
- A cross-sectional evaluation of the usefulness of the minor features of Hanifin and Rajka diagnostic criteria for the diagnosis of atopic dermatitis in the pediatric population. Indian J Dermatol. 2021;66:583-90.
- [CrossRef] [PubMed] [Google Scholar]
- The role of patch testing with Indian cosmetic series in patients with facial pigmented contact dermatitis in India. Indian J Dermatol. 2021;66:81-6.
- [CrossRef] [PubMed] [Google Scholar]
- Atopy patch test. Indian J Dermatol Venereol Leprol. 2019;85:338-41.
- [CrossRef] [PubMed] [Google Scholar]
- Patch testing methodology In: Patch testing and prick testing: A practical guide official publication of the ICDRG. Germany: Springer; 2012. p. :35-77.
- [CrossRef] [Google Scholar]
- Type-IV sensitization profile of individuals with atopic eczema: Results from the Information Network of Departments of Dermatology (IVDK) and the German Contact Dermatitis Research Group (DKG) Allergy. 2006;61:611-6.
- [CrossRef] [PubMed] [Google Scholar]
- Contact sensitization to common haptens is associated with atopic dermatitis: new insight. Br J Dermatol. 2012;166:1255-61.
- [CrossRef] [PubMed] [Google Scholar]
- Allergic contact sensitization in the general adult population: A population-based study from Northern Norway. Contact Dermatitis. 2007;56:10-5.
- [CrossRef] [PubMed] [Google Scholar]
- Association between adult atopic dermatitis, cardiovascular disease, and increased heart attacks in three population-based studies. Allergy. 2015;70:1300-8.
- [CrossRef] [PubMed] [Google Scholar]
- Evaluation of patch test results in patients with contact dermatitis. Dicle Med J. 2011;38:471-6.
- [CrossRef] [Google Scholar]